
News | Stories
2021 Progress Report: Sustainable Operations

Each year, we track several several indicators that show progress toward achieving our sustainable-operations goals. The trends revealed by this data show us where we need to stay the course and where we need to make changes.

We add up the annual electricity use of individual offices to calculate the firm's total electricity consumption. For offices that are not individually metered, we estimate use by dividing the whole building's consumption by the proportion of the building we occupy. Electricity use rose with an increase in employees and locations over the years but has decreased since 2016 as a result of greater energy efficiency in our operations. Decreased office electricity use in 2020 and 2021 also reflects an increase in remote work due to the COVID-19 pandemic.

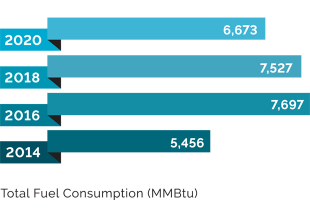
Total fuel consumption had risen following a large merger in 2015, which increased numbers of employees and office locations. However, it fell in 2020, possibly due to the increase in remote work during the pandemic. The firm’s opportunities for reducing fuel consumption is limited as the fuel we use is primarily from heating our offices; we lease our office space, and HVAC systems are typically controlled by the building manager. We update fuel consumption in our greenhouse-gas emissions inventory every two years, so the most recent figure draws from 2020 data.
 (Note: MT CO2e is metric tons of carbon-dioxide equivalent.)
Our total carbon footprint captures the carbon emissions of our offices in five areas under Scopes 1 and 3: electricity consumption, heating and cooling, business travel by plane, employee commuting and office waste. This figure shows our carbon footprint before offsetting emissions (bars above), and our carbon footprint with offsets and renewable energy certificates (bars below). Carbon offsets and RECs have a significant impact on lowering our carbon footprint. In 2020 and 2021, our carbon footprint (before offsetting emissions) fell by as much as 32 percent – which in part can be attributed to the remote work and reduced business travel necessitated by the pandemic.
 (Note for energy and emissions charts: Data does not include estimates for post-2018 acquisitions in baseline year (2018) totals.)
Our average carbon footprint per employee is an important measure of our energy-conservation efforts. It’s also used to determine reduction targets for our path to carbon neutrality. To calculate this metric, we divide total carbon emissions by the number of employees. This figure shows data before carbon offsets (bars above) and with offsets and renewable energy certificates (bars below). Our target for the year 2030 is an average carbon footprint per employee of 2.27 MT of CO2e; in 2021, we came close to achieving that target, with a footprint of 2.32 MT CO2e. To achieve carbon neutrality, we are aiming for high reductions of energy use paired with carbon offsets to neutralize remaining emissions.

This is the percentage of office products with “eco features” that we purchase from Staples, from which we purchase about 60 percent of our office supplies. Staples defines “eco features” as recycled content or compliance with environmental certification standards like Green Seal or the Forest Stewardship Council. This figure does not include an assessment of supplies purchased through other suppliers. The decline in green purchasing in 2020 and 2021 may be due to increasing our use of other suppliers and a resulting reduction in the variety and number of items we purchased through Staples.