R&D and technology play an essential role in our firm. We invest in constant learning, testing and innovation. That uniquely positions us to solve our clients’ most difficult problems.
Innovation EngineOur CORE groups manage our research and development efforts, from incremental efficiency improvements to solving some of the most challenging engineering problems of our time.Learn More
Innovation OutputWe believe collaboration amplifies our innovation potential and creates connections that lead to better, more imaginative solutions for our clients.Learn More
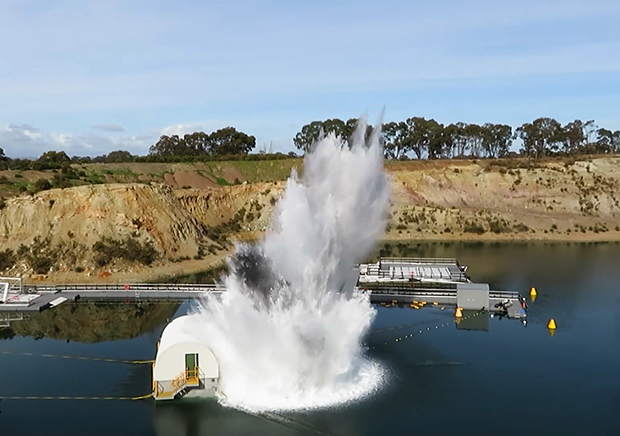
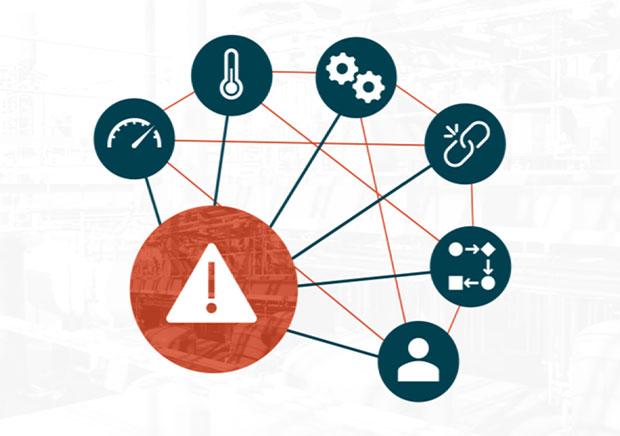
Industrial system failures rarely result from a single event. Learn how root cause analysis and systems-level thinking reveal the technical, operational, and organizational factors that drive equipment failures, disputes, and catastrophic losses.
A backup generator can restore power, but resilience starts with understanding what cannot fail. Learn how critical facilities can reduce operational risk by prioritizing essential loads, dependencies, building performance, and recovery.
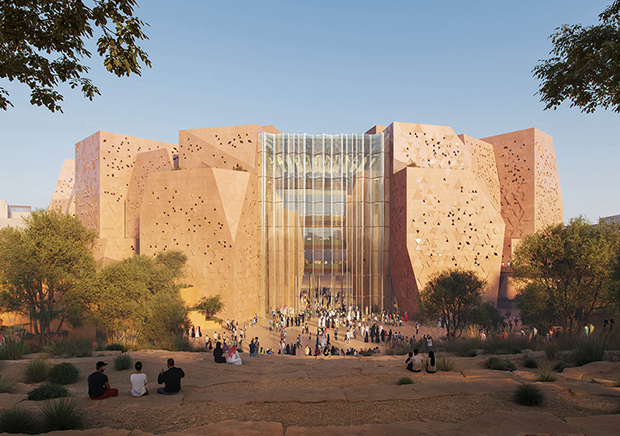
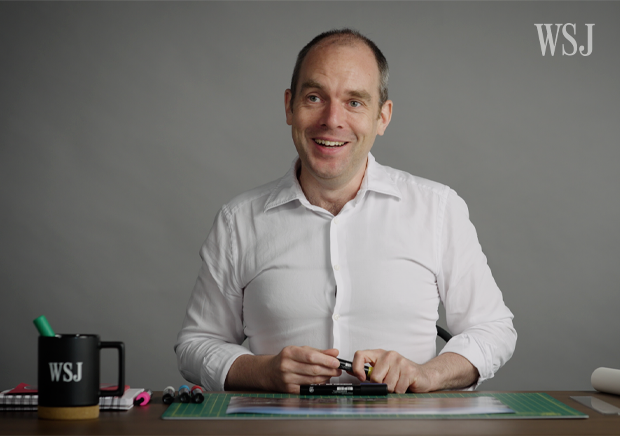
What makes a stadium work for soccer? Jeroen Janssen explores how sightlines, roof design, pitch conditions and venue adaptability influence players, fans and the atmosphere of the game—especially as FIFA World Cup 2026 brings a wide range of stadium types into focus.
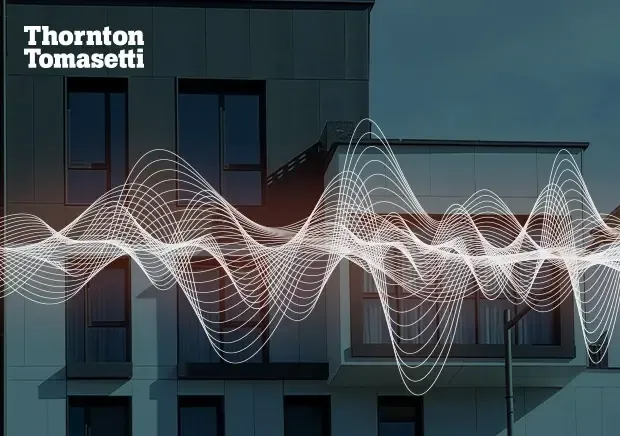
How can homeowners reduce buzzing electronics, rattling pipes, traffic noise and sound traveling through walls or floors? In a recent New York Times article, we share practical strategies for controlling common household noise and creating quieter, more comfortable living spaces.
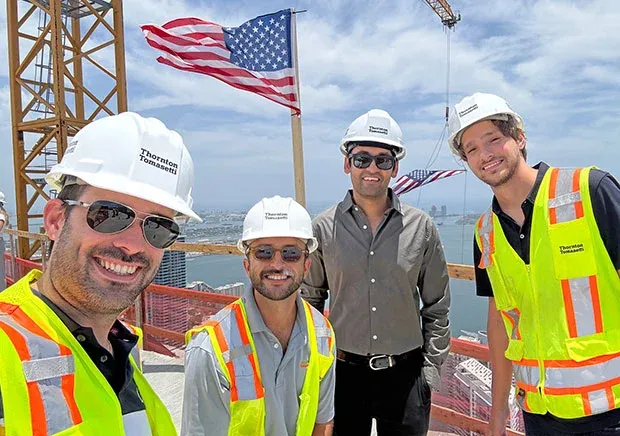
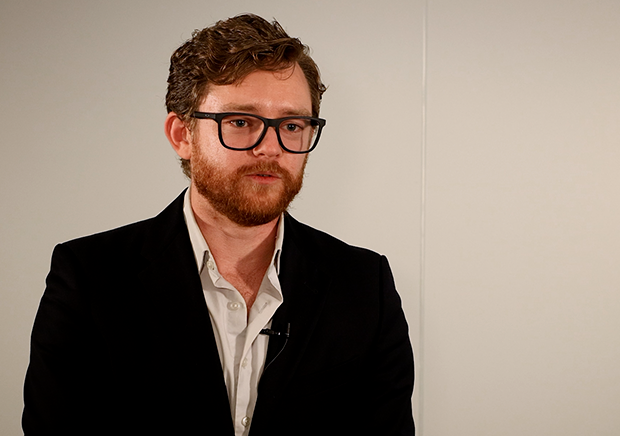
Classified government work is rarely delayed by technology alone. Workforce clearance, governance, facility design, and operating model decisions often become the critical path unless they are planned early.