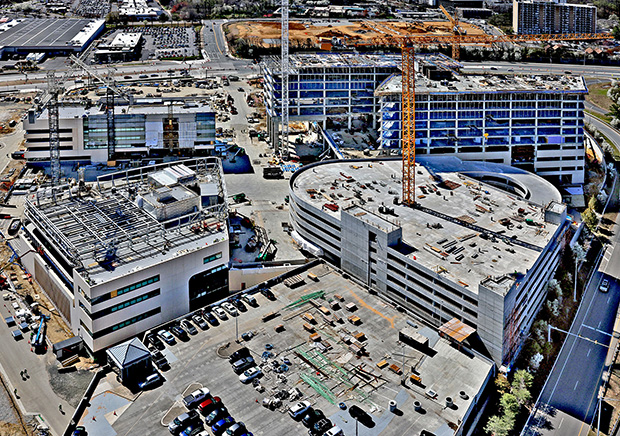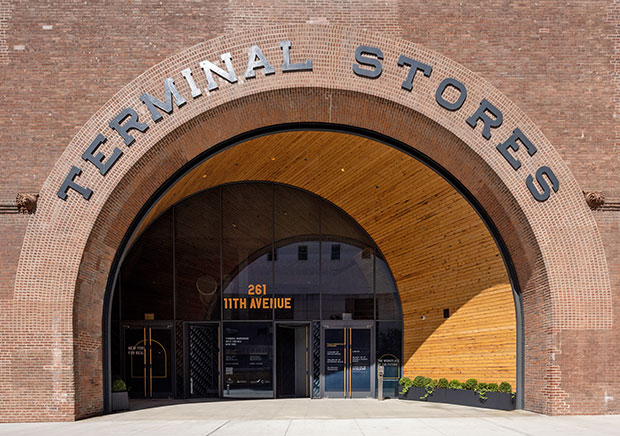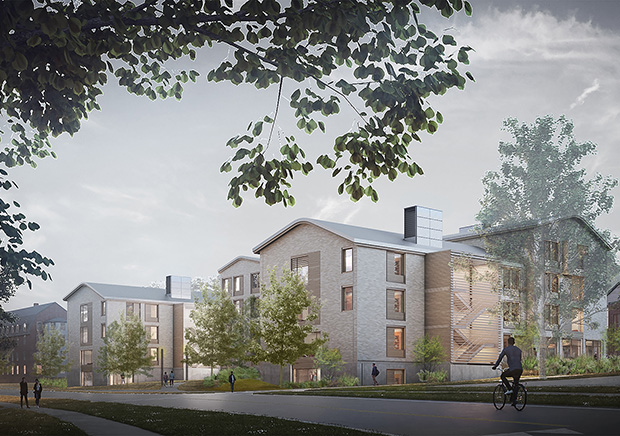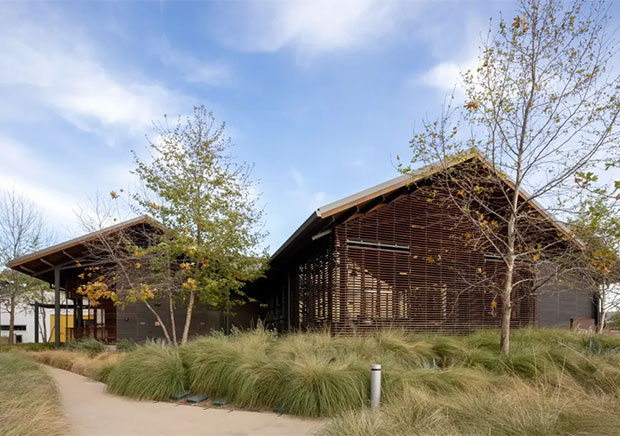

Steve Freihon/Related-Oxford
New York, New York
Global experience.
Regional perspective.
Local impact.

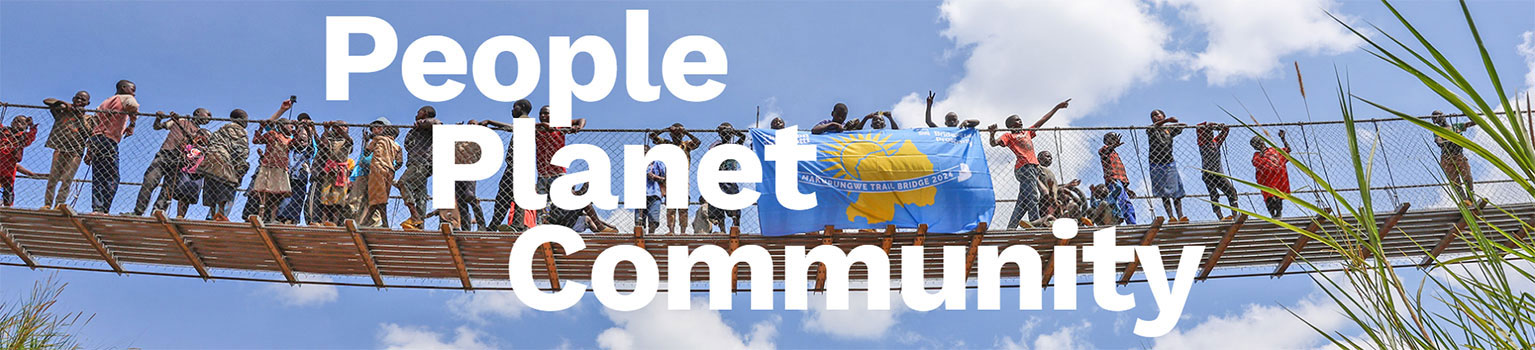
Corporate responsibility is fundamental to how Thornton Tomasetti does business. To us, measuring impact means looking beyond our footprint to actively expand our handprint—valuing what we give back to our people, the planet, and the communities we serve.
The decisions we make in our projects, our operations, and the culture we build for our people are an opportunity to create positive change.
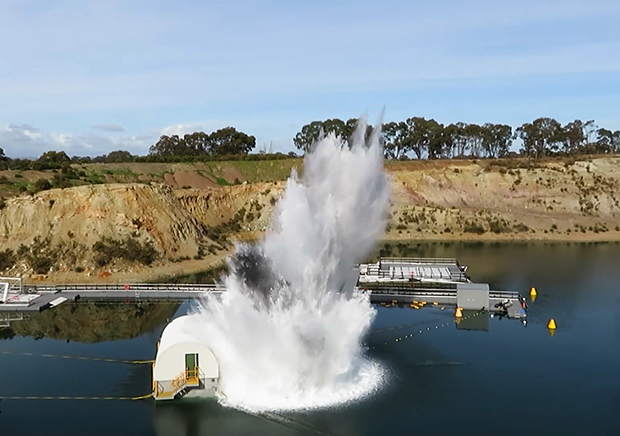
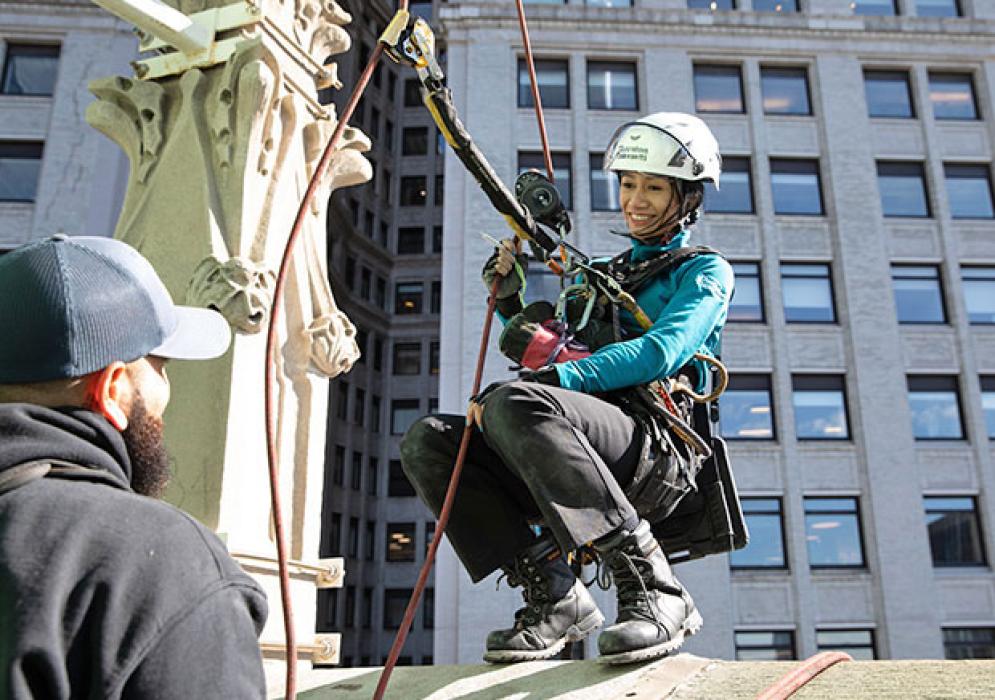
Thornton Tomasetti’s handprint is the positive impact we create through our work. It’s the difference we make when we use engineering, science, and innovation to help clients solve problems in ways that both deliver solutions and improve outcomes. In doing so, we embrace challenges to make lasting contributions.

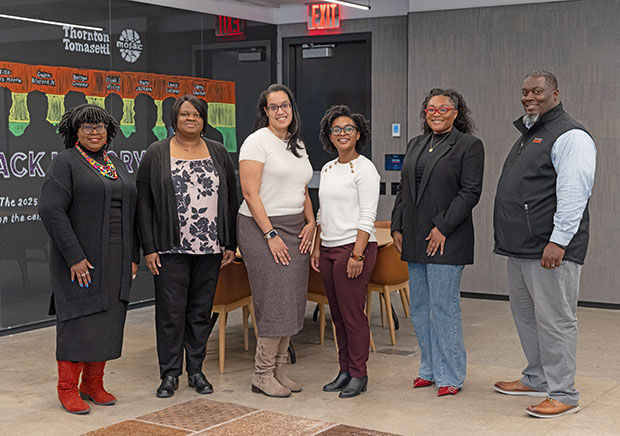
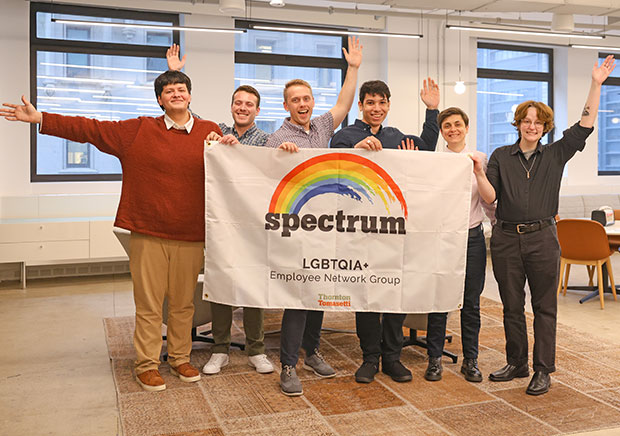
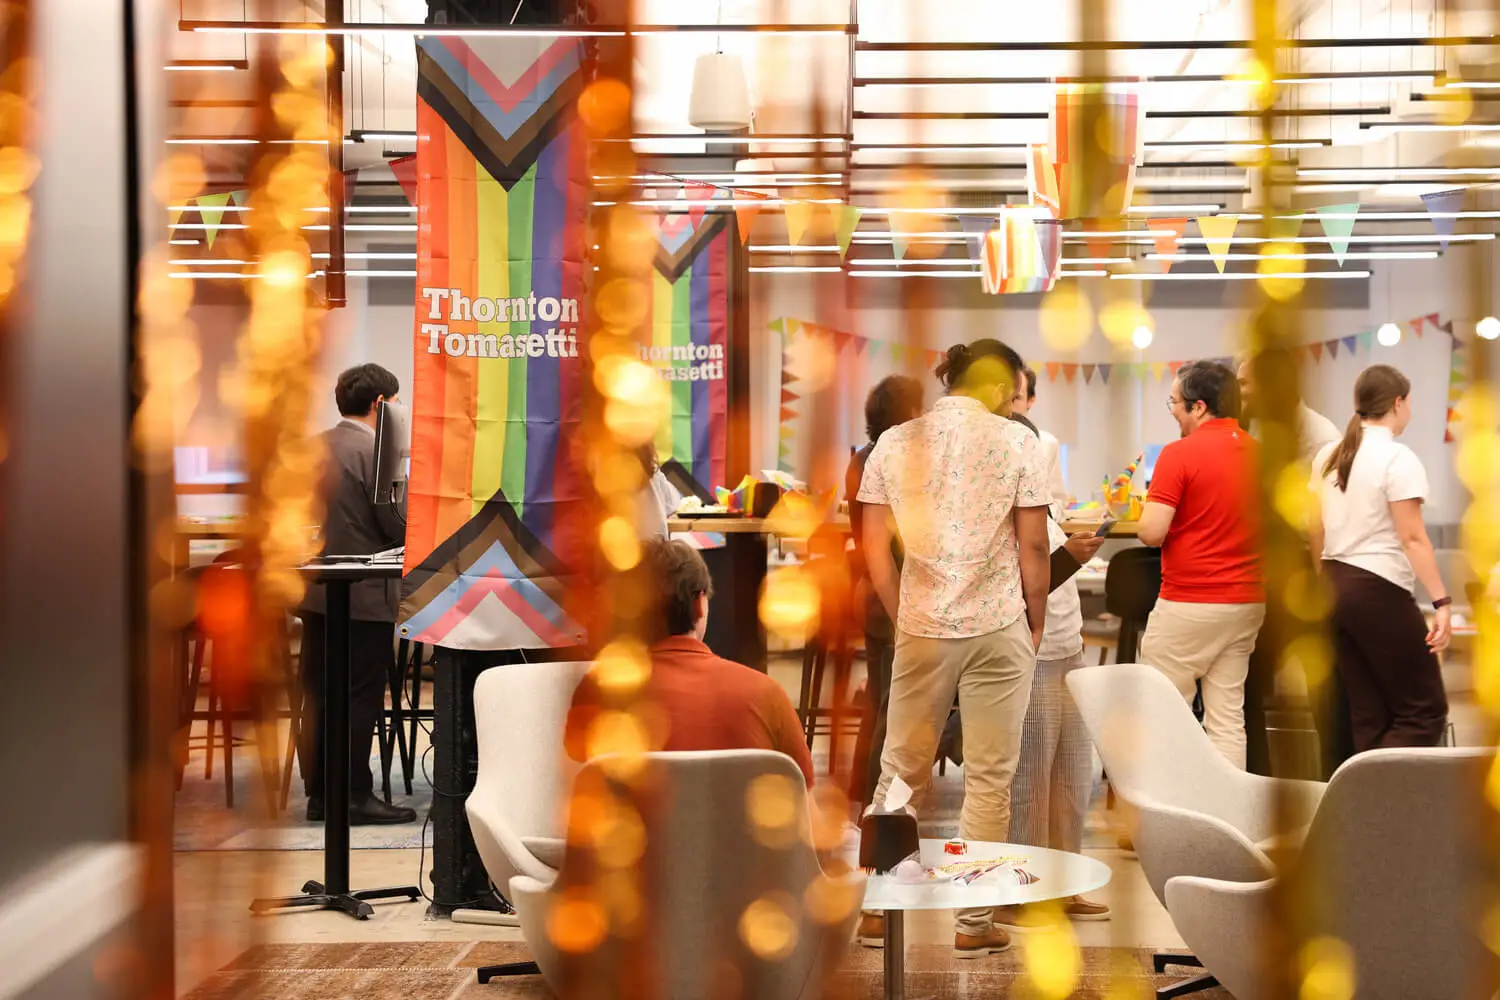
People: How we support our teams, advance safety, grow careers, and create an inclusive culture where people can thrive.
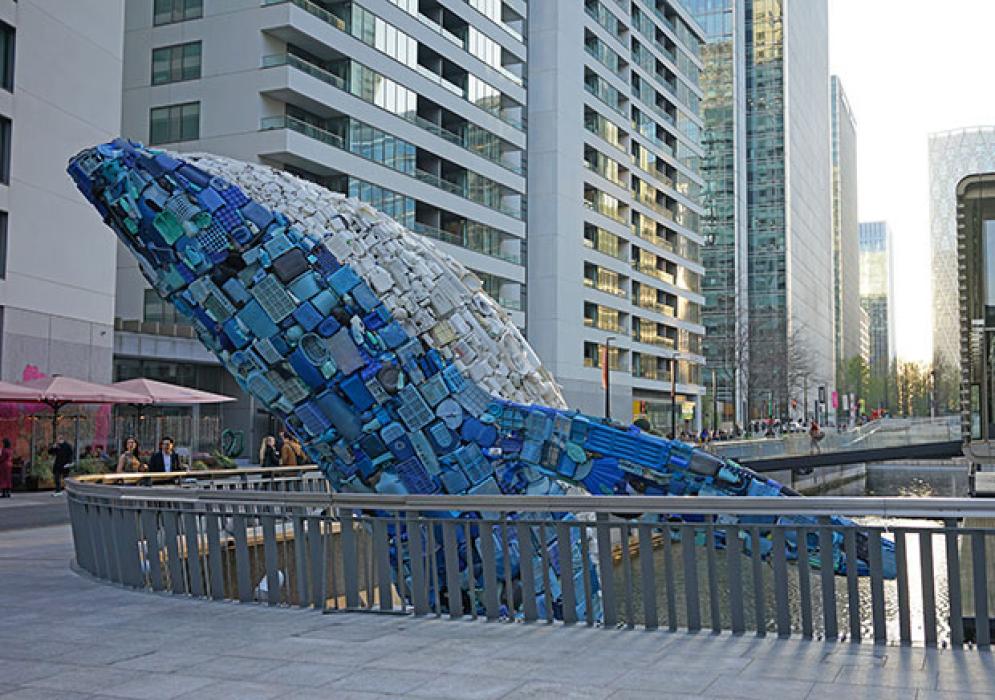
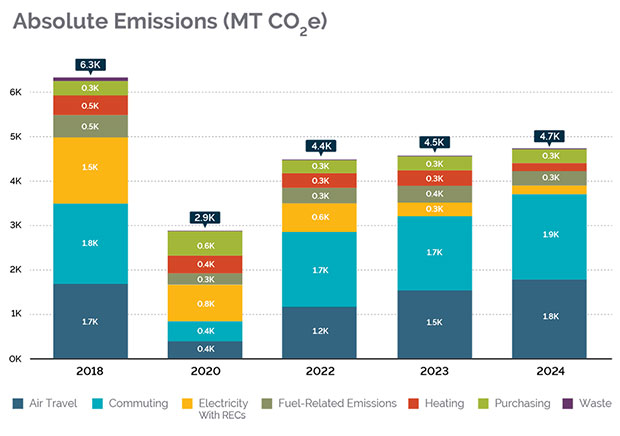
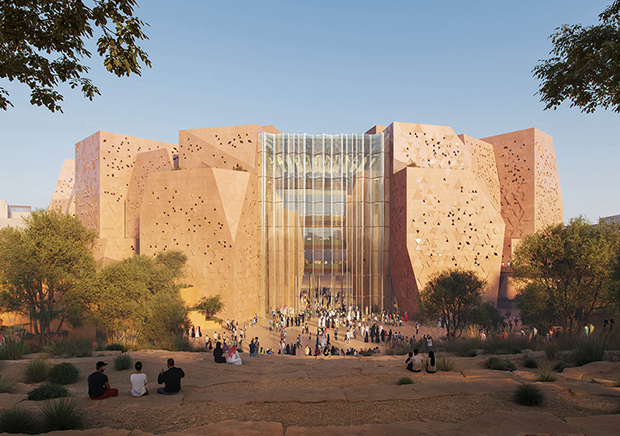
Planet: How we help decarbonize, improve performance, and advance climate action through smarter design, materials, and systems.
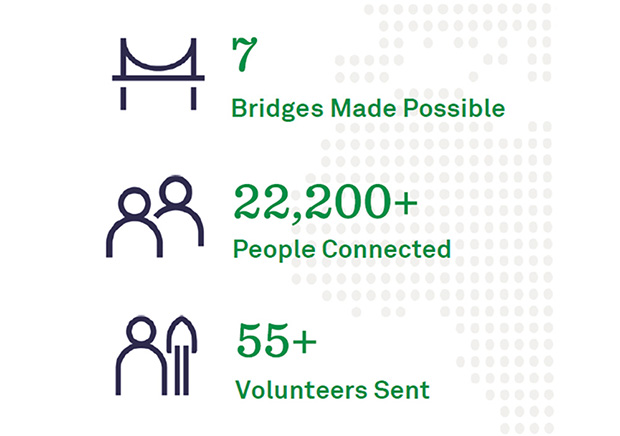
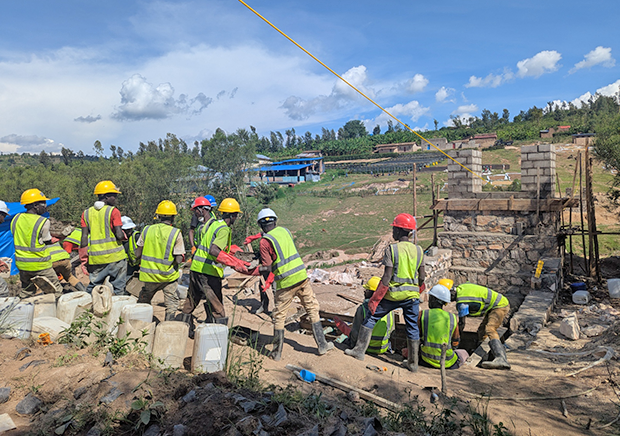
Community: How we strengthen the places we live and work and create safer, more resilient buildings and infrastructure that support everyday life.
Together with our clients and partners, we’re expanding our handprint through the choices we make on projects, in operations, and in the way we show up as a firm.
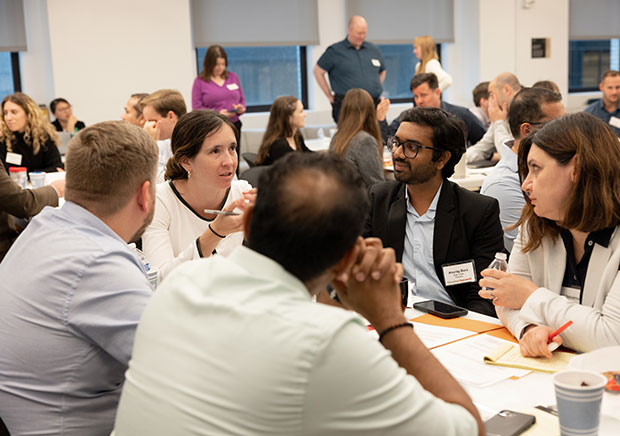
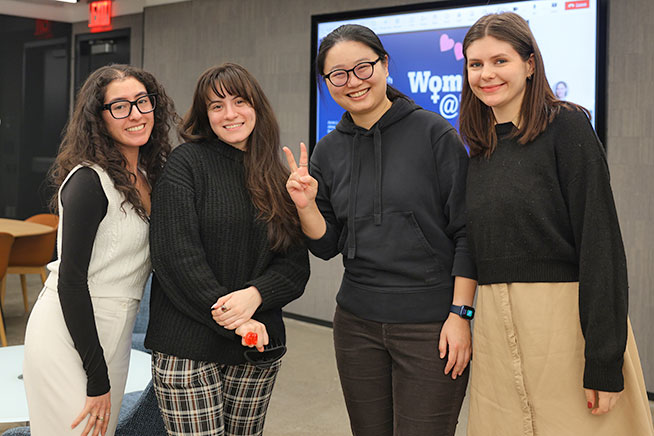
Our People
People are the essence of Thornton Tomasetti. That’s why we recruit diverse talent, develop highly effective leaders and create rewarding careers. We invest in the success of our people throughout their tenures, expanding opportunities to learn, lead and innovate in the areas that drive our collective success. Our commitment is to build a firm where people from all backgrounds feel supported, can achieve their ambitions and contribute to a vibrant, inclusive workplace.