
Steve Freihon/Related-Oxford
New York, New York
Global experience.
Regional perspective.
Local impact.
New York, New York
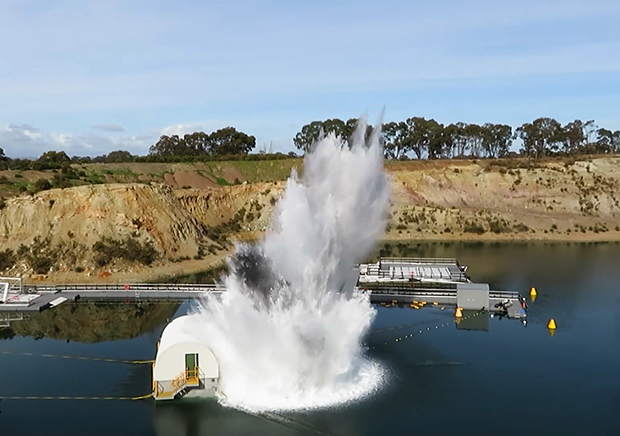
Australia

London, United Kingdom
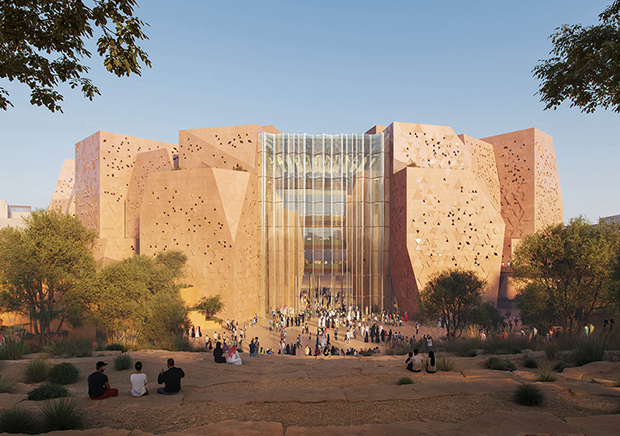
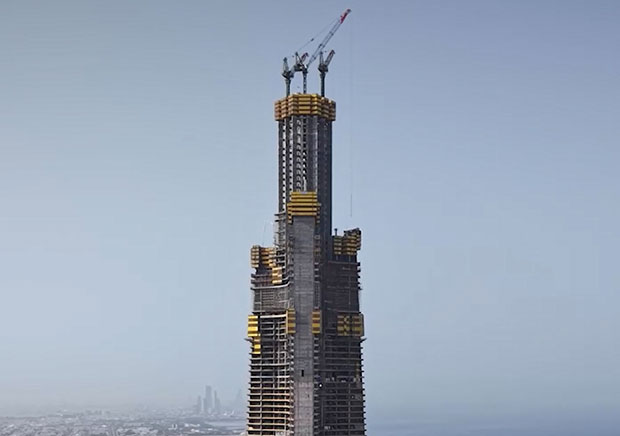
Diriyah, Riyadh, Saudi Arabia
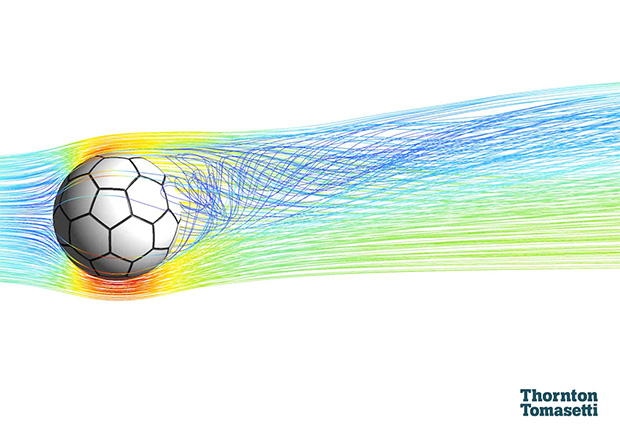
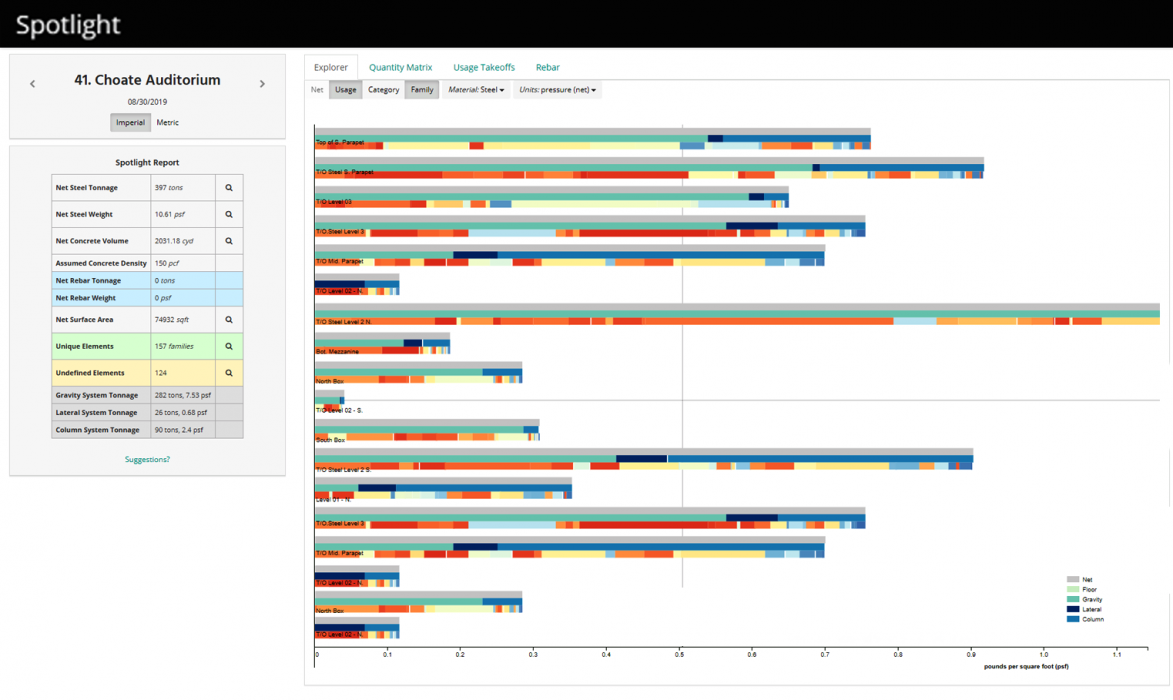
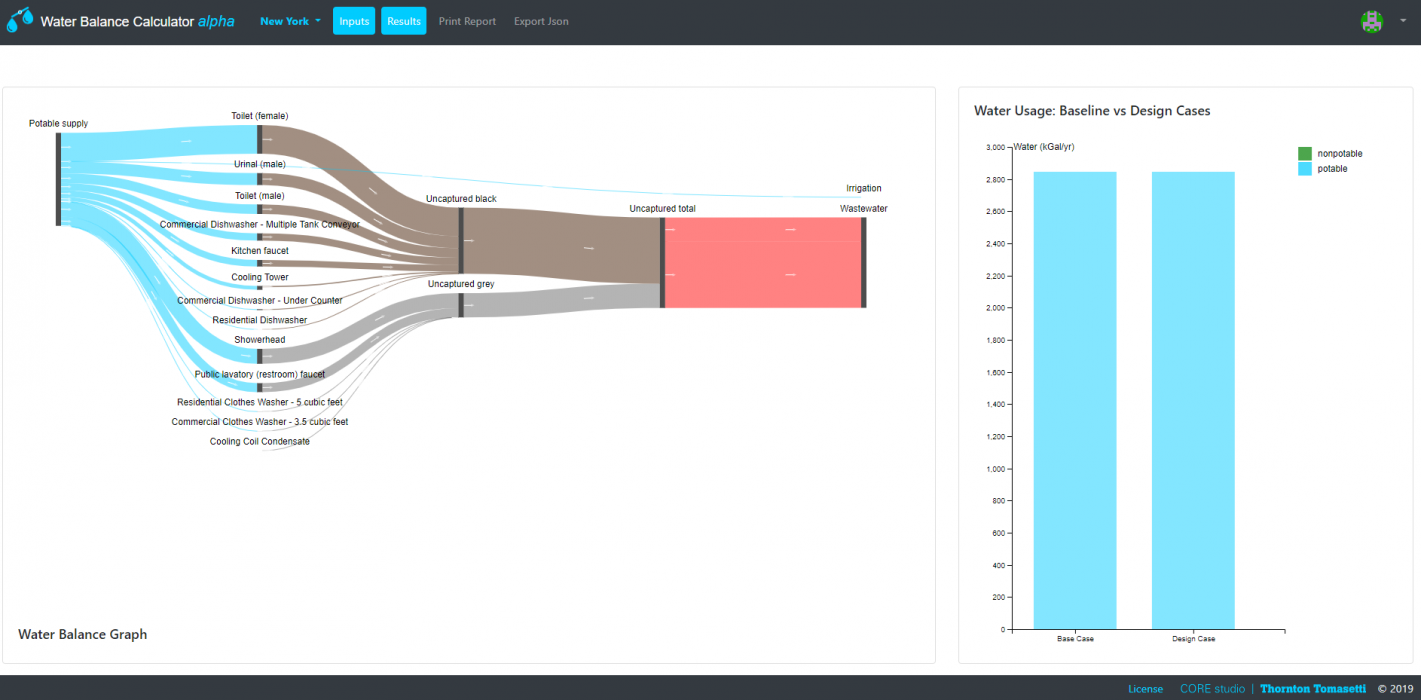
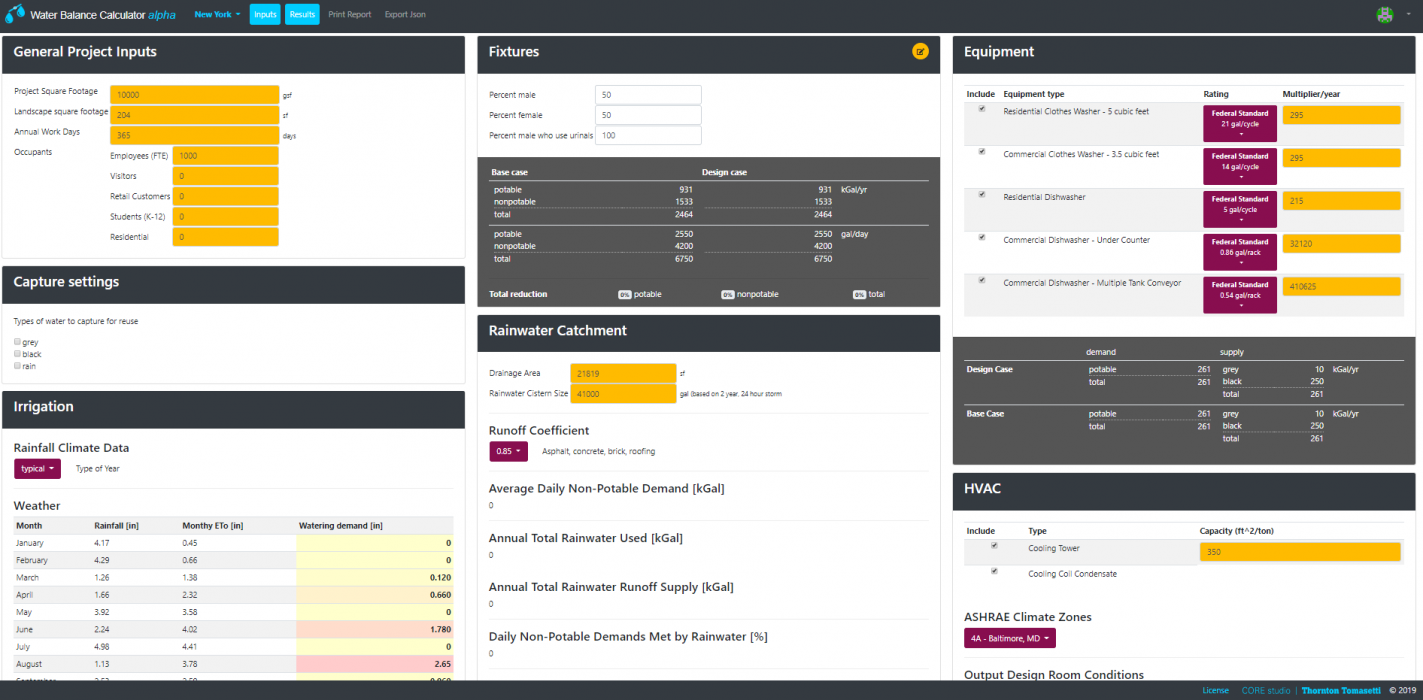
Tired of clicking through multiple layers to find information hidden in your models? We transform “invisible” BIM data into colorful, customizable 3D visualizations – instantly available and easy to analyze.


Your BIM data should be a source of information, not frustration. So our CORE studio is always finding new ways to make it more accessible – and more useful. We make the information latent in your models visible, transforming it into colorful, interactive visual experiences. We give you near-infinite ways to query, map, report on, manage and display your data.
Featured Project
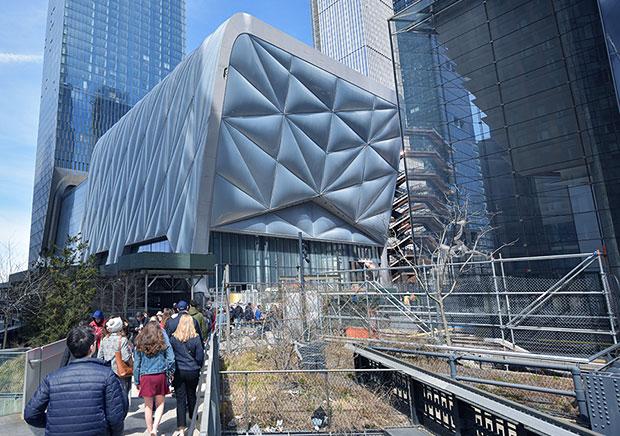
The Shed How do we make an avant-garde arts center so flexible, it’s future-proof? Make it move, of course!Featured Project
VIA 57 West Unique buildings need equally unique structures. Our custom solutions deliver them cost-effectively, with built-in efficiency and resilience.
Featured Project
30 Hudson Yards How to build a 101-story, 2.6-million-square-foot office tower, the tallest at Hudson Yards, atop an operational rail yard.Featured Project
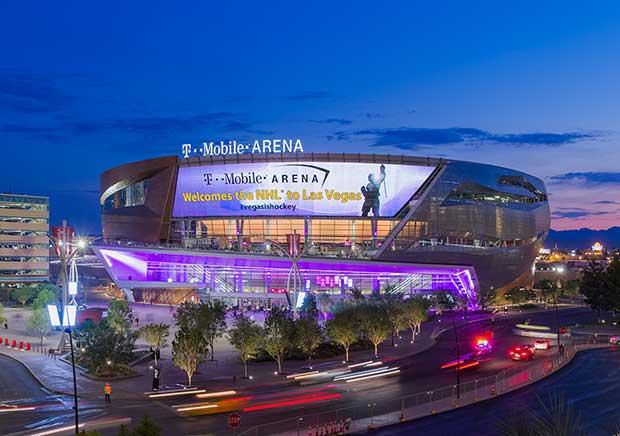
T-Mobile Arena In Las Vegas’ largest arena, excitement can reach epic levels. But as the energy builds, our solutions keep things rock solid.Featured Project
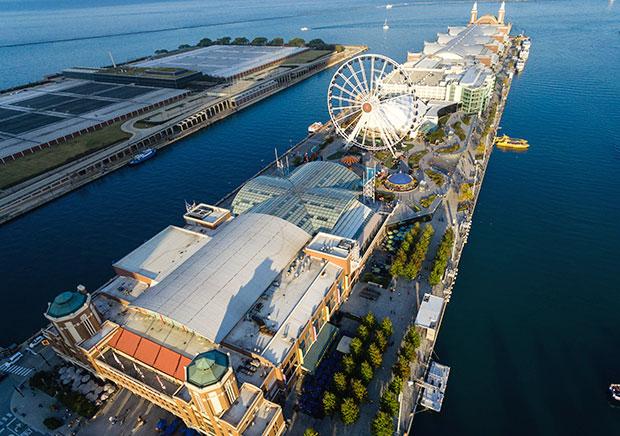
Navy Pier Rebuilding Chicago’s #1 tourist destination wasn’t easy. We pulled back layers of history, went under and over the water, and wove in reinforcements.Featured Project
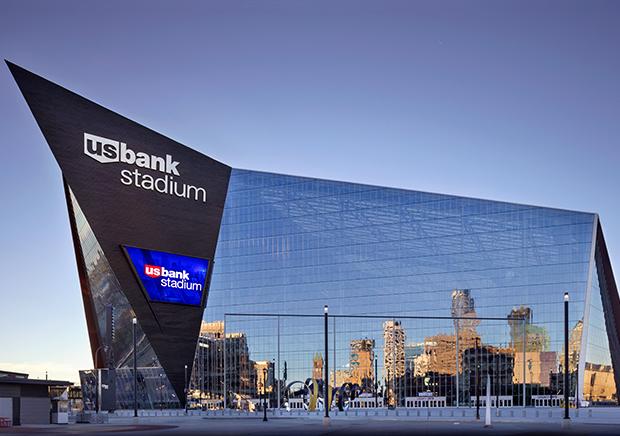
U.S. Bank Stadium How do you make one stadium perfect for summer and winter without breaking the bank? Explore all ideas and open new doors with kinetic design.Featured Project
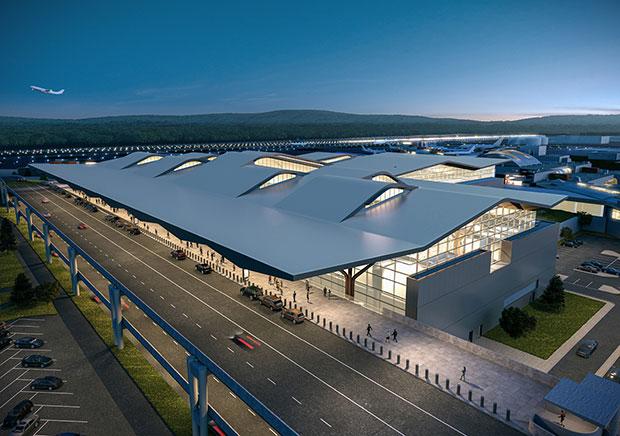
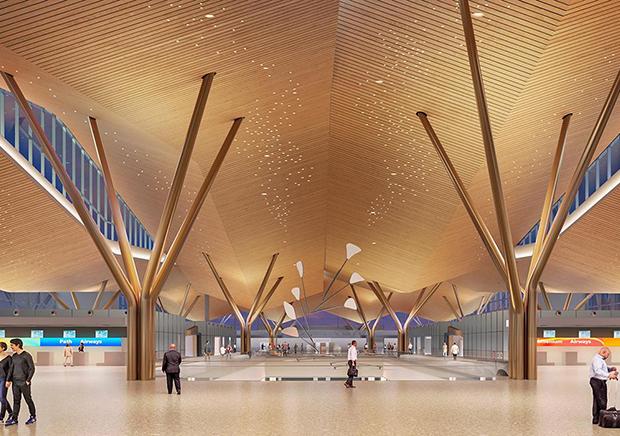
Pittsburgh Airport Terminal Modernization The modern world is on the move. To keep up with millions of air passengers today means building an airport for tomorrow.News
Pittsburgh Int'l Airport Featured in Modern Steel Construction